How to use ExpertOption
What is ExpertOption?
ExpertOption is a market leading digital trading platform, established back in 2014 — The company has over 25 million registered traders from more than 150 countries worldwide. Throughout this article we will guide you through the trading platform, and explain exactly how you can use ExpertOption to start earning money.
Some of the main points we will cover include:
- Setting up the graph
- Opening a deal
- Social Trading
- Cancelling a deal
How does ExpertOption Work
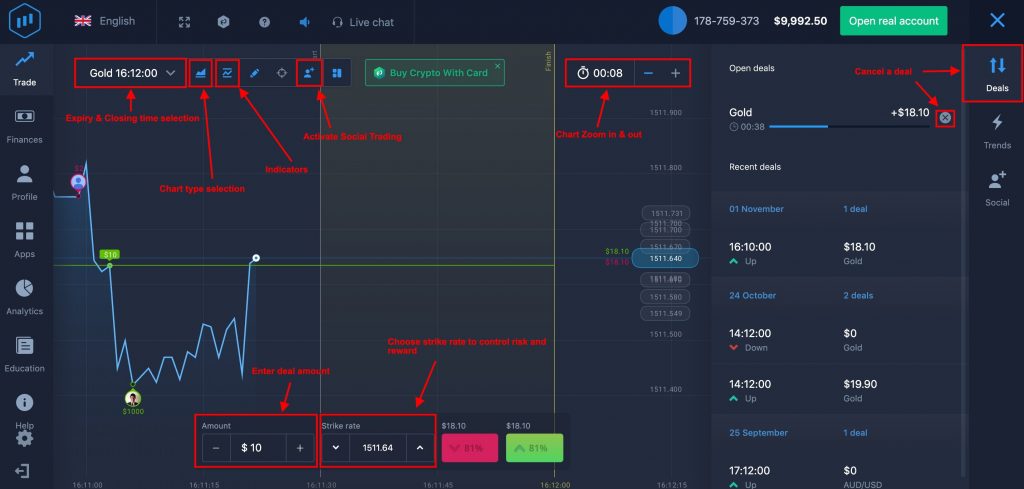
The focal point of the platform is the main graph, this area displays the real-time price of your selected asset. It’s crucial to familiarise yourself with this graph as it will be your greatest tool when trading.

The left side of the platform features buttons for Trade, Finances, Profile, Apps, Analytics, Education, Help, Setting, and Exit. Clicking the Trade button takes you straight to the main graph, whilst the Finances button is where you must deposit and request withdrawals. The Education section is self explanatory, although the Profile section contains many an interesting statistic, as well as the ‘Trade Journal’ which provides an account of your entire trading history.
On the right you will see three buttons, marked as Deals, Trends, and Social. Clicking on Deals opens a sidebar on the right side of the screen displays your most recent deals. Selecting Trends displays trends in a right sidebar, with your choice of One to five-minute intervals.
Assets & Closing Times
The top left of the platform is where you will find the asset selection drop down menu, this is where you can choose precisely which instrument you’d like to trade with, as well as choosing the closing time for the forthcoming deal. ExpertOption provides access to a hugely impressive list of popular stocks, commodities, currencies and cryptocurrencies for you to trade — when making your selection you will also be presented with the current payout percentage, and most recent change in profitability which is vital to note, as this will ultimately determine how much money you can make with an asset.
Main Toolbar
The toolbar to the right of the asset selection drop down menu will provide you with all the tools necessary to effectively analyse the graph, divided into buttons for charts, indicators, drawings, and social trading. These buttons can be used to switch between the four chart types: area, bar, line, or candles. There are eight indicators to choose from, which include Awesome Oscillator, RSI, Bollinger Bands and Fractal to name a few. Once activated these indicators allow the trader to fully customise the graph for their trading requirements — a number of drawings and lines can be added with ease.
Social Trading
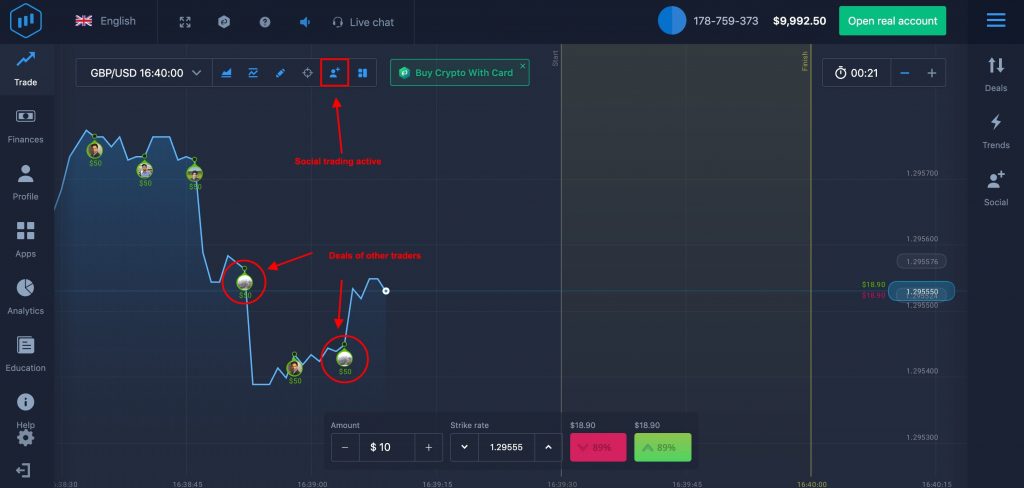
Social trading allows users to toggle the deals of other traders on and off, when active you’ll be able to see the exact amount and time they traded. This is particularly useful for novices who often require guidance or the confidence that copying a more experienced trader can bring;

Deal Amount & Strike Rates
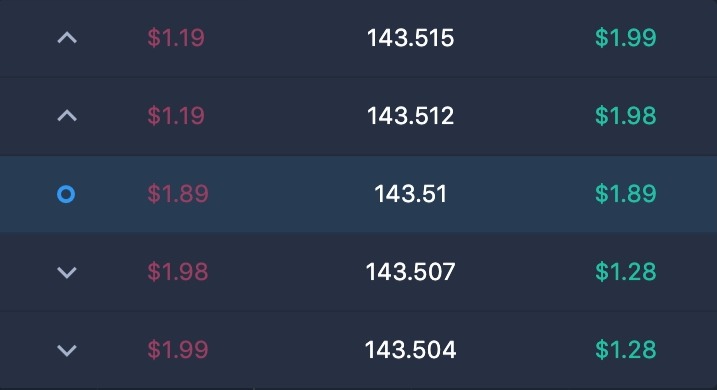
The panel located at the bottom of the graph is where trades are made. The left panel allows for the deal amount to be entered, whilst the right panel lets you choose a strike rate, otherwise known as entry point. By doing this you can either increase your potential profit, but also risk or the reverse, decrease profit but reduce risk. It’s certainly a handy way to take more control over the entire trading process.

Placing a Deal
Once you’ve chosen your asset, closing time, set-up the graph and decided how much to invest — it’s time to place a deal! Depending on whether you believe the price will increase or decrease you’ll make your prediction. Green opens an upward prediction whilst Red a downward one. The following video provides a visual guide;
Cancelling a Deal
Cancelling a deal is a simple process on ExpertOption, navigate your way to the «Deals» panel, where you will see a ‘x’ next to your active deals — click this to cancel the order and to receive a percentage of your deal amount back. It is only recommended that you utilise this feature in situations where a loss appears the most likely outcome.
Summary
These are just a few of the more important features to help you get started, remembering that the $10,000 Demo should be used to the maximum to build an increased understanding of the platform and its processes. Each tab and panel provides some way to gain an advantage and help you to navigate the financial markets more effectively.
Leave a Reply
* Your email address will not be published. Required fields are marked